You ran PageSpeed Insights, saw a red or orange Core Web Vitals badge, and now you have a list of cryptic warnings: “Largest Contentful Paint element”, “Reduce the impact of third-party code”, “Avoid large layout shifts”. The advice online is a pile of plugins and toggles, and it is hard to tell which one will move your score.
This guide is about core web vitals wordpress sites actually need to fix, in the order that pays off. You will learn what each metric measures, how to find the single element or script causing the problem, and which WordPress-specific changes fix it. You will also learn which popular tricks do nothing for your scores, so you stop wasting time on them.
No magic numbers are promised. Every site is different, and the right fix depends on what your diagnosis shows. What you get is a repeatable process: measure, find the cause, change one thing, measure again.
Key takeaways
- Core Web Vitals are three metrics: LCP (loading), INP (responsiveness) and CLS (visual stability). A page passes only when all three are in the “good” range for at least 75% of real visits.
- Field data (real users) decides your pass or fail. Lab tests such as Lighthouse are for debugging, not for the verdict.
- Most WordPress LCP problems come from a slow server response, an unoptimized hero image, or a hero image that is lazy-loaded by mistake.
- Most INP problems come from too much JavaScript: page builders, sliders, chat widgets, tag managers and ads.
- Most CLS problems come from images without dimensions, late-loading fonts, ads and embeds that reserve no space, and cookie banners.
- A caching plugin helps, but it is not a Core Web Vitals fix on its own. Treat it as the foundation, then fix the specific bottleneck.
What Core Web Vitals are and why they matter
Core Web Vitals are a set of user-experience metrics defined by Google. They measure three things a visitor feels: how fast the main content appears, how quickly the page reacts when they tap or click, and whether the layout jumps around while loading.
According to Google’s web.dev documentation, the “good” targets are:
- Largest Contentful Paint (LCP): 2.5 seconds or less, measured from when the page starts loading.
- Interaction to Next Paint (INP): 200 milliseconds or less.
- Cumulative Layout Shift (CLS): 0.1 or less.
To pass, a page needs to meet all three at the 75th percentile of page loads, segmented by mobile and desktop. In plain terms, three out of four of your real visitors need a good experience on each metric. A few fast loads on your own laptop do not count.
INP replaced First Input Delay (FID) as a Core Web Vital in March 2024. If you still see advice about FID, it is out of date. FID only measured the delay before the first interaction was handled. INP looks at the responsiveness of all interactions during the visit and reports roughly the worst one, which is a much tougher and more honest test.
How much do they matter for SEO?
Core Web Vitals are part of Google’s page experience signals, but they are one signal among many. Relevance and content quality still dominate rankings. Do not expect a perfect score to rescue thin content. Do expect a slow, jumpy page to lose visitors, which hurts conversions and engagement whatever Google does. If you are working on rankings more broadly, our WordPress SEO guide covers where speed fits in; the safest framing is that vitals are a tie-breaker and a user-experience goal, not a ranking lever to obsess over.
For the bigger picture of site speed, including hosting, themes and plugins, start with the complete WordPress speed optimization guide. This article zooms in on the three vitals.
Field data vs lab data: read your results correctly
This is the single most misunderstood part. You will see two kinds of numbers, and they often disagree.
Field data
Field data comes from real Chrome users visiting your site, collected in the Chrome User Experience Report (CrUX). It is what Google uses for the pass or fail assessment. You can see it in the top section of PageSpeed Insights (“Discover what your real users are experiencing”), in Google Search Console’s Core Web Vitals report, and in the CrUX dashboards.
Field data is a rolling window of recent visits, so a fix you ship today takes weeks to show up fully. Low-traffic pages may have no field data at all. In that case, PageSpeed Insights falls back to origin-level data or shows nothing.
Lab data
Lab data comes from a simulated load: the Lighthouse section lower down in PageSpeed Insights, or Lighthouse in Chrome DevTools. It runs on a throttled, standardized device. It is repeatable, which makes it ideal for finding causes and testing fixes. But it is not your real audience, and it cannot measure real interactions, so it does not report INP at all. It reports Total Blocking Time (TBT) instead, which is a useful proxy for JavaScript-related sluggishness.
The practical workflow
- Check Search Console’s Core Web Vitals report to see which URL groups fail and on which metric.
- Open PageSpeed Insights for one representative URL from each failing group. Note the field data first.
- Use the lab diagnostics to find the cause. The LCP element, the layout shift culprits and the long tasks are all listed.
- Fix one thing, retest in the lab, and wait for field data to catch up before declaring victory.
Test your main templates, not every URL. A WordPress site usually has a handful: the home page, a blog post, a page built with your page builder, an archive, and (for stores) product, cart and checkout pages. Fixing a template fixes every page that uses it.
Reading Search Console and PageSpeed Insights, step by step
Google’s documentation for the Search Console Core Web Vitals report says its data comes from the Chrome User Experience Report, that similar pages are bundled into URL groups with one status for all their URLs, and that when a group lacks enough data Search Console uses a broader origin group instead. Each device type has its own report and status, so a group can be good on mobile and need improvement on desktop. Group values reflect the last 28 days of user data, and a group’s status is its worst-performing metric.
| Metric | Good | Needs improvement | Poor |
|---|---|---|---|
| LCP | 2.5 seconds or less | Up to 4 seconds | Over 4 seconds |
| INP | 200 milliseconds or less | Up to 500 milliseconds | Over 500 milliseconds |
| CLS | 0.1 or less | Up to 0.25 | Over 0.25 |
Those are the boundaries Google lists in the report documentation. web.dev recommends measuring at the 75th percentile of page loads, segmented across mobile and desktop.
A procedure that avoids false alarms
- Open Search Console → Experience → Core Web Vitals and switch between the mobile and desktop reports.
- Click a failing status to see the issue, such as “LCP issue: longer than 2.5 s”, and the URL groups affected.
- Pick one URL from each failing group and run PageSpeed Insights on it. Read the field data section first, then the lab diagnostics.
- If PageSpeed Insights shows no field data for that URL, it does not mean the page is fine. Google says a group below the minimum amount of data is omitted from the report, and low-traffic pages may fall back to origin-level data.
- Write down the group, the metric, the URL you tested and the cause you found.
Starting the validation
After you fix a group, Search Console’s Start tracking button begins a 28-day monitoring session. Google’s page says that if the issue appears on no URLs during that window it is considered fixed, and that starting tracking does not trigger re-indexing or other active behavior. In practice that means you should fix the cause properly before you click, and not expect an overnight change.
Before you touch anything: take a baseline and a backup
Performance work involves changing caching, scripts and styles. Any of those can break a layout or a checkout. Do this first:
- Take a full backup, or work on a staging copy if your host offers one.
- Record your starting scores for each main template, plus the real-user numbers from Search Console.
- Write down your current setup: theme, page builder, caching plugin, CDN, and any plugins that load scripts on every page.
- Change one thing at a time. If you switch on ten optimizations at once and something breaks, you will not know which one did it.
Fix LCP: make your main content appear sooner
Largest Contentful Paint marks when the biggest visible element in the viewport finishes rendering. On most WordPress pages that is a hero image, a featured image, a large heading block or a background image. PageSpeed Insights tells you exactly which element it is. Always start there.
LCP time is the sum of four parts: the time to receive the first byte from your server, the delay before the browser starts loading the LCP resource, the time that resource takes to download, and the delay before it is painted. Find the biggest part and attack that.
1. Server response time (TTFB)
If the HTML itself arrives late, nothing else can start. On WordPress, a slow Time to First Byte usually means uncached PHP and database work on every request. The fixes, in order of impact:
- Use full-page caching so visitors get a static HTML file instead of a PHP-generated page. See our comparison of WordPress caching plugins and, if you are looking at paid options, the WP Rocket alternatives roundup.
- Check your hosting. Cheap shared plans that are overloaded cannot be fixed by plugins. A server with a modern PHP version, enough memory and fast storage makes a measurable difference.
- Use a persistent object cache if your site does heavy database work (membership sites, WooCommerce, large menus). Our guide on Redis object cache for WordPress explains when it helps and when it does not.
- Put a CDN in front to shorten the distance for visitors far from your server. See Cloudflare for WordPress for setup and pitfalls, including cache rules for HTML.
- Clean a bloated database. Huge autoloaded options slow every uncached request. See how to clean your WordPress database safely.
Be careful with this one: caching only helps logged-out visitors on cacheable pages. If your test URL is a cart or an account page, or if you are logged in, you are measuring the uncached path.
2. Resource load delay: tell the browser about the hero image early
The browser cannot download your hero image until it discovers it. Discovery is delayed when the image is set as a CSS background, injected by JavaScript, or marked lazy. Common WordPress culprits:
- Lazy-loading the LCP image. Lazy loading is right for images below the fold and wrong for the first big image. WordPress core has logic to avoid lazy-loading the first content image and to add a high fetch priority to it, but themes, builders and optimization plugins can override this. Check the HTML of your LCP image. If you see
loading="lazy"on it, remove that. - Background images in sliders and page builders. A hero set as a CSS background is invisible to the browser’s preload scanner. Using a real
imgelement with a high fetch priority is usually faster. - Sliders. A slider often loads its library first, then builds the first slide, then loads the image. That chain is slow. For above-the-fold content, a single static hero image almost always beats a slider for LCP.
You can raise the priority with the fetchpriority="high" attribute on the one LCP image, or by adding a preload link for it. Use this on one image only. Marking many images as high priority cancels the effect.
3. Resource load time: shrink the hero image
A 2 MB hero image on a mobile connection will fail LCP regardless of anything else. Make sure the image is:
- Sized for how it is displayed. Do not upload a 5000 pixel wide photo for a 1200 pixel slot. WordPress generates several sizes and a
srcset, so use the right image size in your template. - Compressed and in a modern format such as WebP or AVIF. WordPress has supported WebP uploads since version 5.8 and AVIF since 6.5, provided your server image library supports them. Our guide to optimizing images in WordPress covers formats, conversion plugins and lazy loading in detail.
- Served from a nearby location, ideally through a CDN.
4. Render delay: do not block the paint
Even after the image downloads, the browser may refuse to paint because CSS or JavaScript is blocking rendering. Typical causes:
- Large render-blocking stylesheets from your theme, page builder and plugins.
- Web fonts that block text rendering. If your LCP element is a heading, a late font can delay it.
- Synchronous scripts in the head.
The standard remedies are to load only the CSS a page needs, inline a small amount of critical CSS, defer non-essential JavaScript, and use font-display: swap or optional for web fonts. Caching and optimization plugins can automate parts of this, but test the page visually afterward, because aggressive CSS and JS optimization is the most common source of broken layouts.
LCP quick checklist
- Identify the LCP element in PageSpeed Insights.
- Make sure HTML is cached and TTFB is reasonable.
- Ensure the LCP image is not lazy-loaded and is a real image tag, not a background, where possible.
- Give it
fetchpriority="high"or a preload. - Compress and resize it; use WebP or AVIF.
- Remove render-blocking CSS and JS that you do not need on that page.
- Retest on mobile, not just desktop.
Which part of LCP is long? A diagnostic table
web.dev’s LCP optimization guide splits the metric into four subparts and gives guideline shares of the total: time to first byte at about 40 percent, resource load delay under 10 percent, resource load duration at about 40 percent and element render delay under 10 percent. It describes these as guidelines, not strict rules, and warns against converting them into fixed millisecond targets. Use them to see which part is out of proportion on your page.
| Subpart | Guideline share | If it is too long, you will see | WordPress fixes to try |
|---|---|---|---|
| Time to first byte | About 40% | A long wait before anything starts, even on small pages | Page cache, better hosting or PHP version, object cache, CDN or edge cache |
| Resource load delay | Under 10% | The LCP image starts downloading late | Remove lazy loading from it, use a real image tag, set high fetch priority or a preload on one image |
| Resource load duration | About 40% | The image takes long to download | Resize it, use WebP or AVIF, serve it from a CDN |
| Element render delay | Under 10% | The image is downloaded but not painted | Reduce render-blocking CSS and JavaScript, avoid sliders that build the first slide late |
web.dev also says the LCP resource should ideally start loading at the same time as the first resource, and that delay between time to first byte and the start of the LCP download is an optimization opportunity. It adds that you should never lazy-load the LCP image, and that high priority on more than one or two images defeats the purpose.
Find the subparts yourself
- Open the page in Chrome, open DevTools and go to the Performance panel.
- Record a page load, with network and CPU throttling on if you want a mid-range phone profile.
- Find the LCP marker on the timeline and click it to see the element.
- Read the network track: when did the HTML arrive, when did the image request start, when did it finish?
- Compare the gaps with the table. The biggest gap is your first target.
The same page in PageSpeed Insights shows the LCP element and a breakdown in its diagnostics, which is easier to read. Use DevTools when you need to see the order of requests.
Fix INP: make interactions feel instant
Interaction to Next Paint measures how long the page takes to visually respond after a click, tap or key press. It covers input delay (the main thread is busy), processing time (your event handlers run), and presentation delay (the browser renders the next frame). A poor INP almost always means the main thread is overloaded with JavaScript.
Find out what is slow
Lab tools cannot report INP directly, so you need to look at interactions. Options:
- The field INP in PageSpeed Insights or Search Console tells you whether there is a problem.
- Chrome DevTools has a Performance panel and an interactions track. Record a trace while you open the menu, click a tab, or add to cart, and look for long tasks.
- Chrome’s web-vitals extension and the open-source web-vitals library can log interactions on real devices.
- Lighthouse’s Total Blocking Time is a decent proxy: a high TBT usually predicts a poor INP.
The usual WordPress suspects
- Page builders and heavy themes. They ship large JavaScript bundles and generate deep, bloated DOM trees. A big DOM makes every style recalculation slower.
- Third-party scripts. Chat widgets, A/B testing tools, heatmaps, social feeds, review widgets and ad scripts compete for the main thread. They are the most common cause of poor INP on otherwise tidy sites.
- Tag managers loaded with dozens of tags. Each tag is another script that can run during an interaction.
- Sliders, animations, popups and sticky headers that run JavaScript on every scroll or click.
- Heavy plugin front-end code such as live search, filters, mega menus and countdown timers.
- Cookie consent tools that run large scripts or block the thread while they initialize.
How to improve INP
- Remove what you do not need. Audit active plugins and third-party scripts. If a script does not earn its place, delete it. This is the highest-impact and lowest-effort fix.
- Load scripts only where needed. A contact form script should load on the contact page, not site-wide. Plugins such as Asset CleanUp or Perfmatters can unload scripts per page, though you must test carefully. Fluent Forms, for example, loads its assets only on pages that contain a form, which is the behavior you want from any plugin.
- Defer or delay non-critical JavaScript. Delaying scripts until the first user interaction can improve loading metrics, but be aware it can hurt INP if the delayed script then runs a large task at the moment the user first taps. Test both ways.
- Break up long tasks. If you write custom code, split heavy work into smaller chunks and yield to the main thread between them. Avoid layout thrashing in event handlers.
- Reduce DOM size. Simplify page-builder layouts, remove unnecessary wrapper elements, and avoid rendering thousands of nodes at once. Paginate or lazy-render long lists.
- Self-host and trim third-party code. Where possible, load third-party widgets after the page is interactive, or replace them with lighter alternatives.
- Be careful with sticky and animated UI. Scroll-linked effects can keep the main thread busy.
Be honest about trade-offs. Removing a chat widget may lower support contacts. Removing a heatmap tool may hurt your CRO program. The goal is to make a conscious decision, not to strip everything. If a script matters, load it late and test its effect on INP.
WooCommerce and INP
Stores are INP-prone: cart fragments, variation swatches, live filters, upsell popups and payment scripts all add up. For store-specific fixes, use the WooCommerce speed checklist.
INP in practice: three phases and how to record them
web.dev’s INP guide describes three phases that add up to the latency of an interaction. Input delay is the time from the user’s action until event callbacks start running, and long tasks and script evaluation can extend it. Processing duration is the time event callbacks take to complete. Presentation delay is the time the browser needs to present the next frame that shows the result. Its poor boundary is 500 milliseconds.
| Phase | What is happening | Typical WordPress cause | Fix to try |
|---|---|---|---|
| Input delay | The main thread is busy when the user taps | Third-party scripts, tag manager tags, builder scripts running after load | Remove or delay scripts that do not need to run early; test the effect, because delaying can move the work to the first tap |
| Processing duration | Your own handlers run for a long time | Heavy filters, mega menus, add-to-cart handlers, custom code | Break long callbacks into separate tasks, as web.dev recommends, and avoid reading layout right after writing styles |
| Presentation delay | The browser needs a long time to render the next frame | Very large DOMs, many nodes updated at once | Reduce DOM size, add content in smaller steps, and consider content-visibility for off-screen sections |
Techniques web.dev documents
- Yield to the main thread. Break long callbacks into separate tasks. The guide notes that yielding indiscriminately is better than not yielding at all, and shows a more targeted approach that runs only render-critical logic first and defers the rest.
- Avoid layout thrashing. This happens when code updates styles and then reads them in the same task, forcing synchronous layout. Keep reads and writes separate.
- Minimize DOM size. Large DOMs make rendering slower during interactions. Flatten the structure and consider
content-visibilityfor off-screen elements. - Limit client-side HTML rendering. Rendering large amounts of HTML with JavaScript delays the next frame.
- Reduce startup script cost. Parsing, compiling and executing scripts can cause long tasks during page load.
How to record an interaction
- Pick the interactions that matter: opening the menu, using search, choosing a variation, add to cart, submitting a form.
- Open DevTools, go to the Performance panel and start recording.
- Perform the interaction once, ideally soon after load, because web.dev notes the main thread is often busiest then.
- Stop recording and look for long tasks around the moment of the interaction. Note which script file owns each one.
- If the page contains iframes, check which frame the interaction happened in, since each iframe has its own main thread.
- Remove, defer or replace the script, then record the same interaction again.
web.dev also points out that CrUX often does not give the contextual data you would get from a real user monitoring provider. If you need to know which interaction produces your worst INP, consider a RUM tool that records the interaction target, and weigh its own script cost.
Fix CLS: stop the page from jumping
Cumulative Layout Shift scores unexpected movement of visible elements. You have seen it: you go to tap a link, an ad loads above it, and you tap the wrong thing. CLS is usually the easiest vital to fix because the causes are well defined and you can see them in the lab.
Find the shifts
PageSpeed Insights lists “Avoid large layout shifts” and the elements involved. In Chrome DevTools, the Performance panel shows layout shift markers, and the Rendering tab can highlight layout shift regions. Check the mobile view, since narrow screens shift more.
Common WordPress causes and fixes
- Images and videos without dimensions. WordPress adds
widthandheightattributes to images inserted through the editor, which lets browsers reserve space. Problems arise when themes or builders strip them, or when you hard-code images in templates. Always set dimensions or use CSSaspect-ratio. - Embeds and iframes. YouTube, maps, social posts and forms often load with no reserved space. Wrap them in a container with a fixed aspect ratio or minimum height.
- Ads and banners. Reserve the slot’s space with a fixed height, even if the ad does not fill. A collapsing empty slot shifts content too, so decide on a policy and stick to it.
- Web fonts. When a fallback font swaps for the web font and the sizes differ, text reflows. Preload your main font files, use
font-displaysensibly, and choose a fallback with similar metrics. The CSSsize-adjustand related descriptors can match them closely. System font stacks avoid the problem entirely. - Cookie banners and notices. A banner that pushes content down causes a shift. Make it overlay the page or fixed at the bottom with reserved space instead.
- Sticky headers and announcement bars that appear after load and push the page.
- Dynamically injected content such as “related posts” blocks, newsletter popups inserted above existing content, and late-loading widgets. Insert content below the viewport or into reserved space.
- Lazy-loaded images without reserved space. Lazy loading is harmless for layout only when dimensions are known.
- Animations that change layout properties. Use
transformandopacityfor animation rather than animating top, height or margin.
Layout shifts that happen within 500 milliseconds of a user interaction (such as opening a menu) are excluded from CLS, so shifts you trigger deliberately are generally fine. The ones that hurt are those that arrive without being asked.
CLS in practice: web.dev’s causes, mapped to WordPress
web.dev’s CLS guide says to aim for 0.1 or less for at least 75 percent of page visits, with scores above 0.25 counted as poor. It lists a small set of causes, and each has a WordPress version.
| Cause | What web.dev says | Where it shows up in WordPress | Fix |
|---|---|---|---|
| Images and video without dimensions | Set width and height, or reserve space with CSS aspect-ratio | Theme templates and builders that strip attributes | Add dimensions or an aspect ratio in the template or block |
| Ads, embeds and iframes | Reserve space with min-height or aspect-ratio; show a placeholder instead of collapsing the space | Ad plugins, video embeds, map and form iframes | Wrap each embed in a container with reserved space |
| Dynamic content | Avoid inserting banners or UI at the top or bottom of the viewport without reserved space | Cookie banners, announcement bars, newsletter bars | Overlay or reserve the space and avoid pushing the page |
| Web fonts | Use font-display optional, a sensible fallback, size-adjust overrides and preload critical fonts | Theme or builder fonts loaded late | Self-host, trim weights, preload the main file |
| Animations | Avoid animating top, left, box-shadow and box-sizing; use transform | Slide-in menus, sticky headers, hover effects | Rewrite the effect with transform and opacity |
The guide adds that shifts within 500 milliseconds of user input are not counted, but content that needs a network fetch should still reserve its space up front.
Back and forward navigation
web.dev says pages restored from the back/forward cache return with their previous layout, so the fully loaded page is instantly available and users do not see shifts repeat. It recommends making your pages eligible and testing for anything that blocks it. The Performance Lab plugin’s listing names an Instant Back/Forward feature and notes a Site Health test that flags a Cache-Control: no-store header, which disables this cache. If your host or a plugin adds that header to public pages, ask why and whether it can be removed for non-sensitive pages.
Check your shifts
- Run PageSpeed Insights on mobile and read the layout shift elements it lists.
- In DevTools, open the Performance panel and look for layout shift markers on the timeline.
- Reload with the cache disabled, then reload again with it enabled. Some shifts only appear on the first visit.
- Accept the cookie banner and reload to see whether it changes the shift.
- Fix one cause, rerun, and write down the change.
Where the common WordPress optimizations actually help
Not every popular tweak affects every vital. This table keeps expectations realistic.
| Optimization | LCP | INP | CLS | Notes |
|---|---|---|---|---|
| Full-page caching | Strong | Indirect | None | Cuts TTFB for cacheable pages. Foundation for everything else. |
| Better hosting / PHP version | Strong | Indirect | None | Helps uncached pages most. |
| CDN | Moderate | None | None | Helps distant visitors and static assets. |
| Image compression and WebP/AVIF | Strong | None | None | Biggest win when the LCP element is an image. |
| Preload / fetchpriority on hero image | Strong | None | None | Use on one element only. |
| Image dimensions / aspect-ratio | None | None | Strong | The classic CLS fix. |
| Removing unused plugins and scripts | Moderate | Strong | Low | Often the best INP fix. |
| Delay / defer JavaScript | Moderate | Mixed | Mixed | Can improve or worsen INP and CLS. Test. |
| Critical CSS / remove unused CSS | Moderate | Low | Risk of shifts | Can cause flashes of unstyled content if misconfigured. |
| Font preloading and fallback matching | Moderate | None | Strong | Fixes text reflow. |
| Database cleanup | Low to moderate | None | None | Helps uncached requests and admin. |
| Lightweight theme | Strong | Strong | Moderate | Less CSS, JS and DOM. See fastest WordPress themes. |
The pattern: caching and images are your LCP levers, JavaScript hygiene is your INP lever, and reserved space is your CLS lever. A one-click “speed optimization” plugin cannot know which of the three your site fails.
What WordPress core and Performance Lab do for each vital
Core has absorbed some of the advice that used to need a plugin. Knowing which parts exist helps you avoid fighting them.
| Feature | Vital it targets | What the official sources say | Check on your site |
|---|---|---|---|
| Skipping lazy loading for the first content image | LCP | The core team says core began skipping it in 2021 | Inspect the HTML of your LCP image for loading="lazy" |
Automatic fetchpriority for the first large image | LCP | Added in WordPress 6.3; the function never returns both high priority and lazy for one image and does not override attributes you set | Confirm that only one image has high priority |
| Speculative loading | Navigation speed after the first page | Enabled by default in 6.8 with prefetch and conservative eagerness, except for logged-in users or sites without pretty permalinks | Check whether a filter or plugin changes the mode |
| Modern image formats module | LCP | Performance Lab lists a module that generates WebP for uploads | Check which formats your server supports |
| Image Prioritizer and Embed Optimizer modules | LCP and CLS | Performance Lab lists them as depending on Optimization Detective; one reviewer advises against production use of the modules that need it | Test on staging only |
| Instant Back/Forward module | Perceived speed and CLS on return visits | Listed with a Site Health test for Cache-Control: no-store | Check your headers |
Performance Lab requires WordPress 6.9 or higher and PHP 7.4 or higher, and each feature is switched on individually under Settings → Performance. Its own FAQ calls it mostly a beta testing tool. If you try it, keep the features you need and switch off the rest, and treat a change in your field data weeks later as the only proof that it helped.
Core’s defaults are not perfect. Developers have reported cases such as an image inside a collapsed navigation overlay receiving high priority and hurting the real LCP image. That is why the advice in this guide is to inspect the HTML and not assume.
Caching plugins and Core Web Vitals: what to expect
A good caching plugin sets you up for a better LCP by serving pre-built HTML, and many include optimizations for CSS, JavaScript, fonts and lazy loading. That makes them the usual first install. But set expectations carefully.
- They help LCP mainly by lowering TTFB and, optionally, by inlining critical CSS and preloading assets.
- They can help INP by delaying or deferring scripts, but they cannot remove the cost of a script that must run.
- They can cause CLS if CSS optimization or font handling is misconfigured.
- They do nothing for a bad hero image or a slow third-party widget unless you fix those.
Pick one caching solution. Running two page caches, or layering a caching plugin on top of host-level caching without understanding what each does, causes stale pages and odd bugs. Many managed hosts already provide page caching at the server level, in which case a plugin should focus on optimization features only.
Plugins and services that target specific vitals: what vendors document
None of these will fix a vital on its own, and WPMusk has run no tests on any of them. The notes below say what each vendor’s pages state, so you can match a feature to the metric that is failing. Our caching plugin comparison and WP Rocket alternatives cover selection in general.
For LCP
WP Rocket’s features page lists a feature called Critical Image Optimization that detects and prioritizes the LCP element and excludes it from lazy loading, alongside page caching and cache preloading. That is aimed squarely at the resource load delay part of LCP.
Open the WP Rocket homepage and use the Features menu to find the media and file optimization sections. Match each feature to a row of the LCP table above and ignore any banner claims.

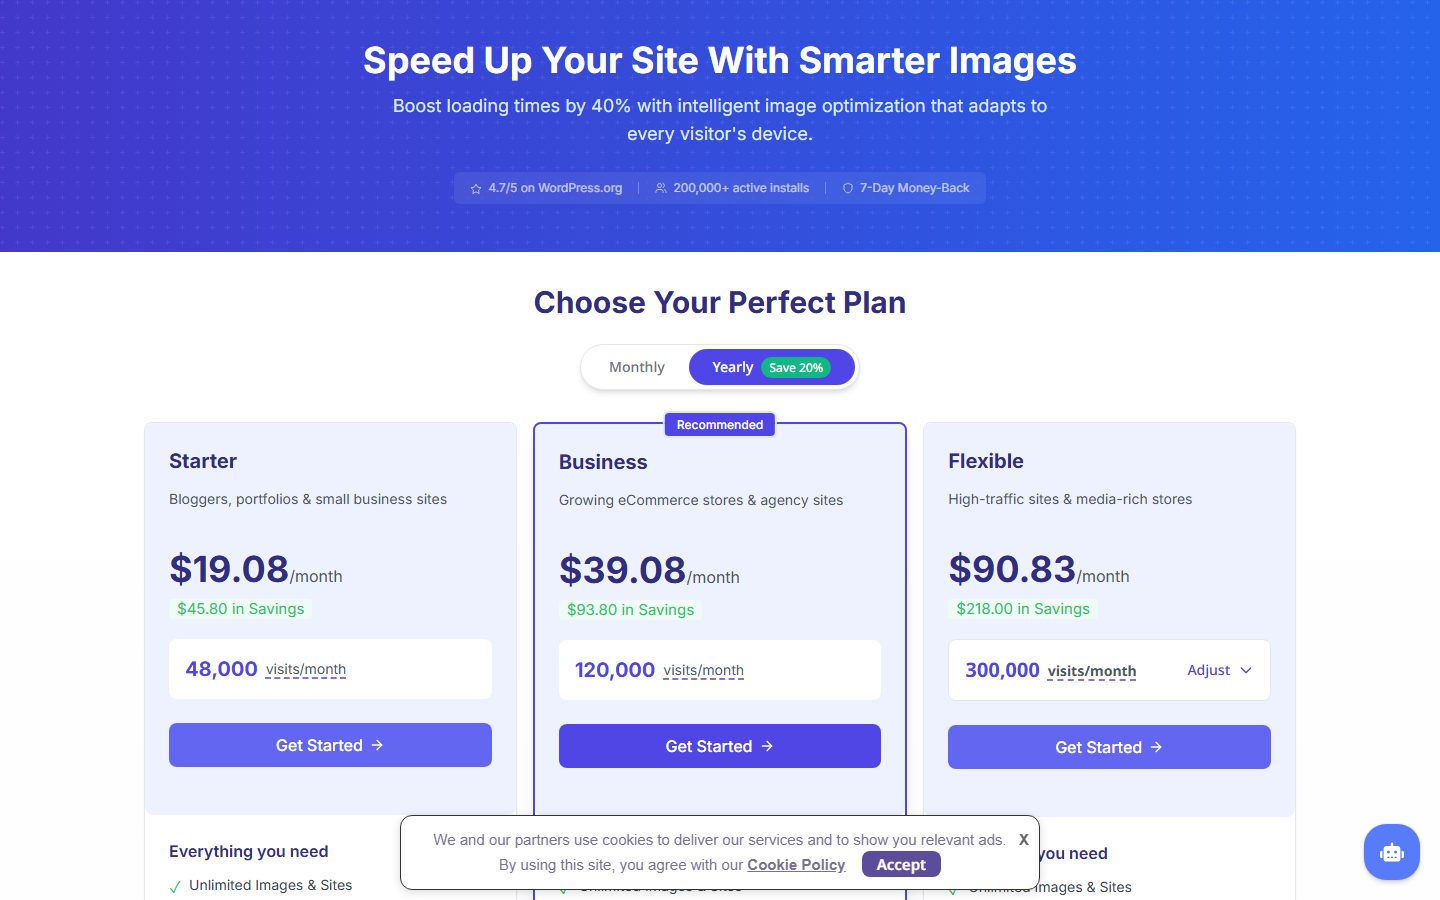
Optimole’s wordpress.org listing describes replacing image URLs with cloud-based ones, adaptive sizing for each device, WebP and AVIF conversion, a CDN and lazy loading. Those address the resource load duration part, with one caution: make sure lazy loading does not apply to your LCP image.
On the Optimole pricing page, note that plans are organized by visits per month. Estimate your traffic before you compare.
For server response and CSS
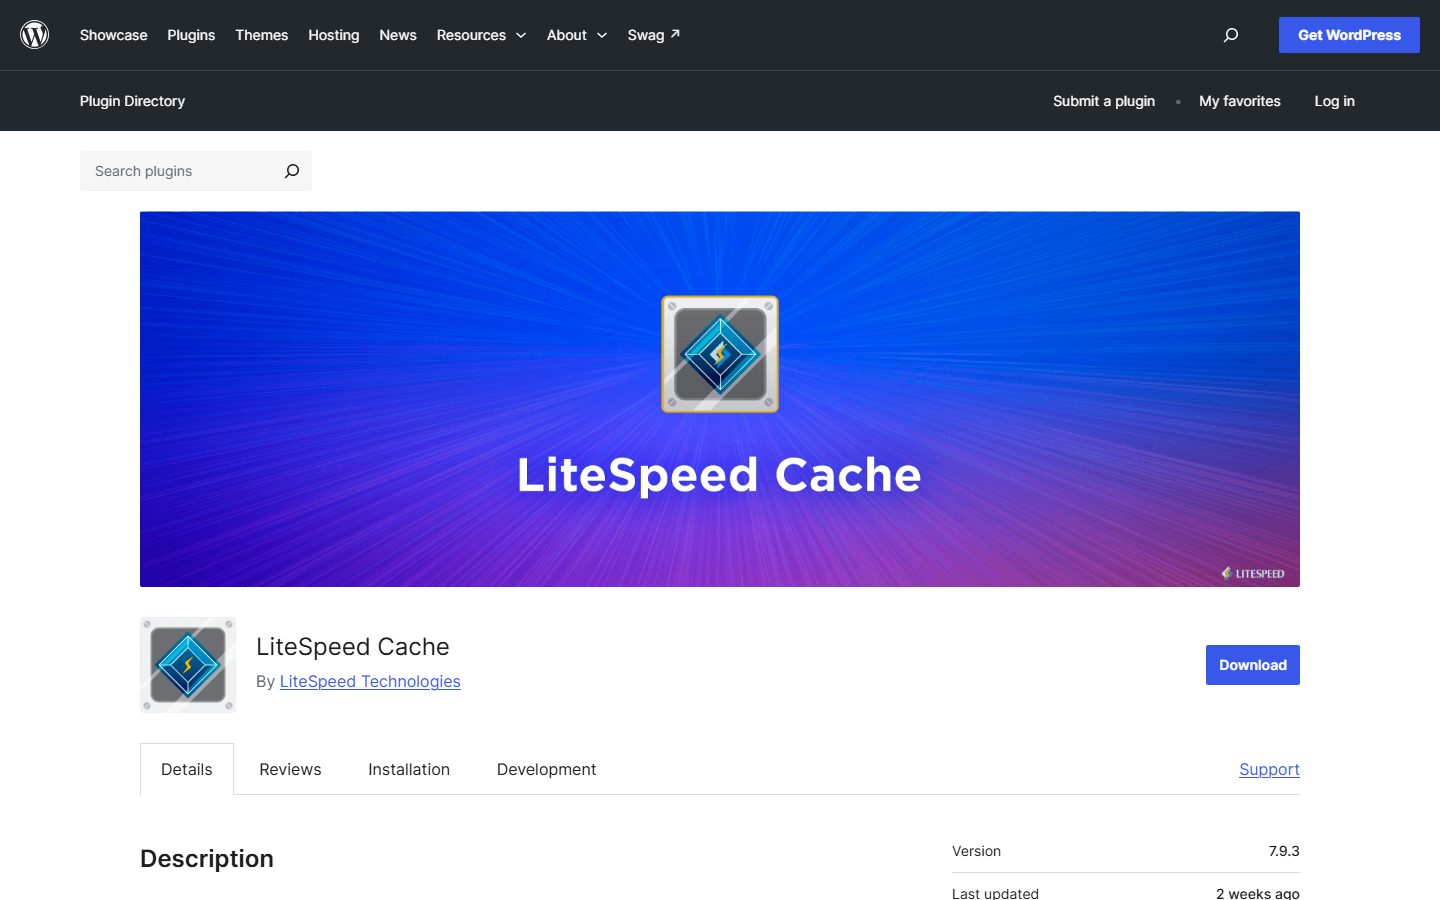
The LiteSpeed Cache listing separates general features from those that need a LiteSpeed server. Critical CSS, minification, lazy loading and delayed or deferred JavaScript are general features, while server-level page caching is exclusive to LiteSpeed environments. If your host does not run LiteSpeed, you will not get that part.
On the LiteSpeed Cache listing page, open the Details tab and read the description. It is where the general and exclusive features are split.
For INP and script control
Perfmatters says it is designed to work alongside a caching plugin and that its main method is disabling scripts you do not need. Its documentation links cover disabling scripts per page, delaying JavaScript and removing unused CSS. Those map to the INP fixes of removing and loading scripts only where needed.
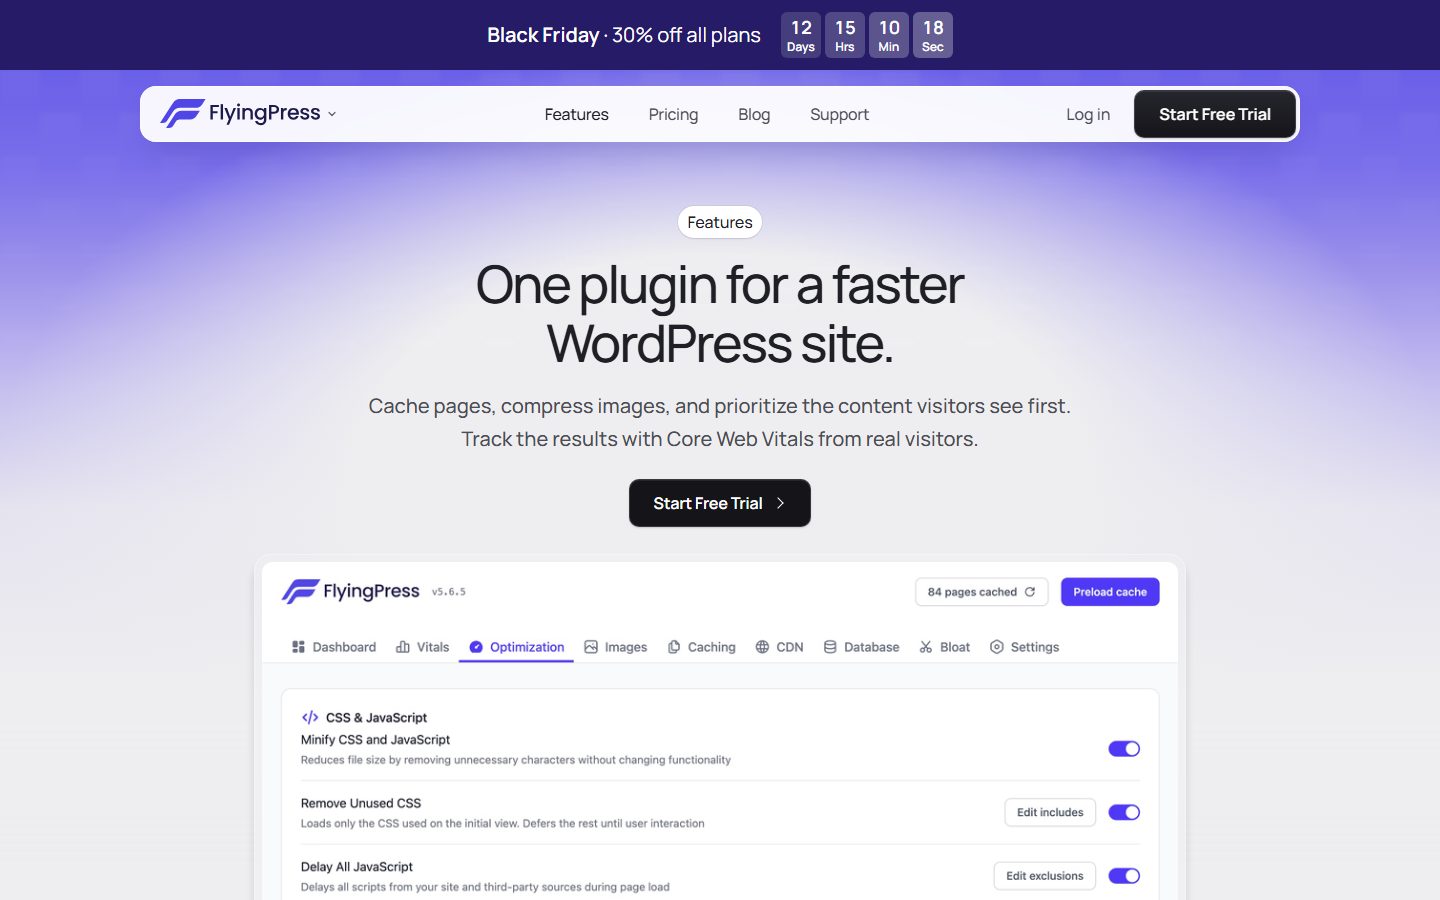
FlyingPress lists tracking of Core Web Vitals from real visitors alongside caching and optimization, and its features page shows toggles for removing unused CSS and delaying all JavaScript, each with an exclusions button. Use exclusions deliberately, since delaying a script your page needs immediately can worsen INP.
On the FlyingPress features page, look at the Optimization panel in the screenshot and find the exclusions buttons next to Remove Unused CSS and Delay All JavaScript.
For an all-in-one service
NitroPack describes a hosted service that optimizes copies of your files, with a built-in CDN, and automates caching, image, font and code optimization. Its homepage makes strong claims, including about passing Core Web Vitals, so check them against your own field data.
| Metric | Feature type | Example documented by a vendor | How to verify it worked |
|---|---|---|---|
| LCP | LCP image priority and exclusion from lazy loading | WP Rocket’s Critical Image Optimization | Inspect the image attributes and rerun the LCP breakdown |
| LCP | Image delivery and format conversion | Optimole adaptive sizing and WebP or AVIF | Check the file size and format in the network panel |
| LCP and CLS | Critical CSS and font handling | LiteSpeed Cache general features | Check for flashes of unstyled content and shift markers |
| INP | Disable scripts per page, delay JavaScript | Perfmatters script control | Record the same interaction before and after |
| All three | Real visitor measurement | FlyingPress Vitals tracking | Compare with Search Console after weeks |
| All three | Hosted automation | NitroPack | Compare field data before and after, with a clean rollback plan |
A step-by-step plan for a typical site
Here is a sequence that works for most WordPress sites. Adapt it to your diagnosis.
- Back up and baseline. Backup, then note Search Console status and PageSpeed results for your main templates.
- Check the foundation. Confirm a current, supported PHP version, a reasonable host, HTTPS and HTTP/2 or HTTP/3. Switch on full-page caching.
- Fix the LCP element. Identify it on mobile, then resize, compress and convert it. Remove lazy loading from it. Add fetchpriority or a preload.
- Reserve space. Add dimensions to images, set aspect ratios on embeds, and reserve slots for ads and banners.
- Audit scripts. List everything loading on the page. Remove, replace or defer. Pay special attention to third-party tags.
- Tidy fonts. Limit font families and weights, self-host if possible, preload the critical file, and set a sensible
font-display. - Trim CSS and DOM. Unload unused assets per page, simplify heavy layouts.
- Retest the lab, then wait for field data. Allow weeks for the CrUX window to refresh before drawing conclusions.
Use cases: what to do depending on your site
A blog or content site
Your LCP is usually the featured image or the headline. Cache pages, compress featured images, avoid sliders, and keep ad scripts under control. Reserve ad space to protect CLS. This type of site tends to reach good scores with modest effort.
A brochure or business site built with a page builder
The builder’s CSS, JavaScript and DOM size are your main issues. Use the builder’s performance options, remove unused widgets and animations, and check that the hero is not a background video or slider. If the builder is still too heavy after tuning, consider a lighter approach. Some teams use a lean builder with a utility framework; for example, Etch with Automatic.css generates much less front-end code than older, widget-heavy builders, though any tool can be slow if it is used badly.
An online store
Product pages, cart and checkout are mostly uncached or partly cached. Focus on server response, an object cache, minimal plugins, and lightweight product galleries. Check INP on filtering, variation selection and add-to-cart interactions. Use the WooCommerce speed checklist.
A membership or LMS site
Logged-in users bypass page caches, so server speed, object caching and database health matter more. Field data may be dominated by logged-in traffic, so test while logged in.
A site with heavy advertising
Ads are the hardest case. Reserve fixed-size slots, lazy load below-the-fold ads, limit the number of ad calls, and accept that the ad network’s scripts will cost you something. Review which units are actually worth their performance cost.
Troubleshooting: symptom, likely cause and fix
| Symptom | Likely cause | What to do |
|---|---|---|
| Lab results are good but field LCP fails | Real phones and networks are slower than the lab profile, or logged-out traffic hits uncached pages | Break LCP into its four parts on a throttled profile and check cache hit behavior for visitors. |
| LCP element changes between runs | A slider, banner or late-loading block competes with the hero image | Replace the slider with a static hero image and remove late banners above the fold. |
| INP is poor only on mobile | Scripts that are fine on desktop saturate a slower CPU | Test with CPU throttling, remove or delay third-party scripts and simplify the DOM. |
| INP worsened after delaying JavaScript | Delayed scripts run as one big task on the first tap | Exclude interaction-critical scripts from delay or load them earlier. |
| CLS appears after the cookie banner | The banner pushes content or loads late | Make it an overlay or reserve its space. |
| CLS only on first visit | Fonts or images load without reserved space | Preload the main font, set dimensions and test with an empty cache. |
| Search Console shows “not enough data” | The URL group has too little traffic | Google says such groups are omitted and origin-level data may be used. Rely on lab diagnostics for these pages. |
| Status did not change after a fix | The 28-day window still contains old visits | Wait the full window, confirm the fix reached production, and check for a cache layer serving old HTML. |
| Different templates fail for different reasons | Each template has its own LCP element and scripts | Diagnose each failing group separately. |
Reporting vitals to a client or manager
A short, honest report builds trust and keeps expectations realistic. Use one table per site and avoid promising a specific score.
| Template group | Device | Failing metric | Cause found | Change made | Next check |
|---|---|---|---|---|---|
| Blog posts | Mobile | LCP | Featured image lazy-loaded | Lazy loading removed, image resized | Search Console in four weeks |
| Product pages | Mobile | INP | Review widget and chat script | Chat delayed after interaction | Record add-to-cart again |
| Home page | Desktop | CLS | Cookie banner pushes content | Banner turned into an overlay | PageSpeed Insights this week |
Explain that field data lags by up to 28 days, and that some pages cannot be measured at all because they have too little traffic. Say what you changed, what you will check and when. That is a better deliverable than a screenshot of a score.
Common mistakes to avoid
- Chasing a 100 Lighthouse score. The score is a lab number and not what Google uses for assessment. A site with a 70 lab score and good field data passes.
- Optimizing for desktop only. Most traffic is mobile, and mobile thresholds are harder to hit.
- Lazy-loading everything. Including the hero image hurts LCP.
- Installing multiple optimization plugins. They fight each other and produce duplicate minification, broken scripts and cache conflicts.
- Combining and minifying blindly. On HTTP/2 and HTTP/3, combining files is less useful than it used to be and often causes breakage. Test before keeping it.
- Delaying all JavaScript by default. It can break menus, forms and checkout, and can worsen INP on first interaction.
- Ignoring third-party scripts. You can optimize your own code perfectly and still fail INP because of a chat widget.
- Testing only the home page. Archives, posts and landing pages may be the ones failing.
- Not retesting after plugin or theme updates. Vitals regress quietly. Check monthly or after significant changes.
- Skipping security while optimizing. Performance plugins that edit server config or
.htaccess, or that unload scripts, can create security and stability issues. Keep your site hardened; see the WordPress security guide.
Monitoring Core Web Vitals over time
Vitals drift. A new plugin, an updated ad script or a redesigned banner can undo your gains. Set up light monitoring:
- Google Search Console gives URL-group status and shows when a group moves from good to needs improvement.
- PageSpeed Insights on your key templates after every significant change.
- Real user monitoring using the web-vitals JavaScript library sent to your analytics, if you want faster feedback than CrUX gives you. This is optional and adds a small script, so weigh the benefit.
- A change log. Keep a note of what you changed and when, so a regression can be matched to a cause.
If you manage several sites and want help auditing and applying settings, tools that let an AI agent operate WordPress, such as NibWP, can automate repetitive checks like listing active plugins or reviewing settings. They are an aid, not a substitute for understanding the diagnosis.
Core web vitals wordpress checklist
Print or copy this list and work through it for each template.
Loading (LCP)
- LCP element identified on mobile.
- Full-page caching active for logged-out visitors.
- TTFB is reasonable on a cached page.
- Hero image resized, compressed, in WebP or AVIF.
- Hero image is not lazy-loaded and has high fetch priority or a preload.
- Render-blocking CSS and JS reduced.
- Fonts preloaded and set to swap or optional.
Interactivity (INP)
- Unused plugins and scripts removed.
- Third-party tags reviewed and loaded late where possible.
- Assets loaded only on pages that need them.
- DOM size under control.
- Key interactions (menu, search, add to cart, form submit) tested in DevTools.
Stability (CLS)
- Width and height or aspect-ratio on images, videos and embeds.
- Ad and widget slots have reserved space.
- Cookie banner and announcement bar do not push content.
- Font fallback matched or system fonts used.
- No late injection of content above the fold.
When to get help or change approach
Some problems are structural. If you have tried the fixes above and still fail, ask whether the foundation is wrong:
- Your host is the bottleneck. Persistent high TTFB on cached pages points to the server. Moving hosts is sometimes the only fix.
- Your theme or builder is too heavy. If every page ships hundreds of kilobytes of unused CSS and JS, a lighter theme may be cheaper than endless tuning.
- Your business depends on scripts that are slow. Then accept the trade-off and optimize around it.
- The admin is also slow. That suggests a server or database problem. See why your WordPress admin is slow.
Hiring a performance specialist makes sense when you have a complex stack, heavy custom code or a revenue-critical store. Give them your diagnosis so they do not start from scratch.
A four-week plan and what to do this week
| Week | Focus | Actions |
|---|---|---|
| 1 | Diagnose | Open Search Console, list failing URL groups, run PageSpeed Insights on one URL per group, record causes |
| 2 | LCP and CLS | Fix the LCP image and its priority, set dimensions, reserve space for banners and embeds, preload the main font |
| 3 | INP | Audit scripts, remove what you do not need, delay selectively, record key interactions before and after |
| 4 | Verify and protect | Retest the lab, check field data, start validation where a group is fixed, schedule monthly checks |
If you only have an hour this week, do this: open the Core Web Vitals report, pick the worst failing group, run PageSpeed Insights on one URL from it, and write down the LCP element, the longest task and the biggest shift. That one page of notes is worth more than any plugin you could install today.
FAQ
What is a good Core Web Vitals score?
There is no single score. Each metric has a “good” threshold: LCP at 2.5 seconds or less, INP at 200 milliseconds or less, and CLS at 0.1 or less. Google assesses these at the 75th percentile of real page loads, separately for mobile and desktop. Your page passes when all three metrics are good. The 0 to 100 score in Lighthouse is a different, lab-based number and is not the pass or fail measure.
Why does PageSpeed Insights show different results each time?
Lab tests run on simulated conditions, and network, server load and third-party scripts vary between runs. Run it a few times and compare trends, not single numbers. Field data is much more stable because it aggregates many real visits. If lab and field disagree, trust field data for the verdict and use the lab only for diagnosis.
Does a caching plugin fix Core Web Vitals?
Partly. Page caching reduces server response time, which helps LCP for cacheable pages. It does not fix oversized images, slow third-party scripts or unreserved layout space. Most sites need caching plus targeted fixes for their specific failing metric.
How long until my fixes show in Search Console?
Search Console uses CrUX data collected over a rolling period of about 28 days, so improvements appear gradually. After you ship fixes, you can use “Validate fix” in the report, and Google monitors the affected URLs over a number of weeks. Expect to wait several weeks before the status changes, depending on your traffic.
Why is my INP bad when my site looks fast?
A page can paint quickly yet stay busy running JavaScript, so the first tap or click gets a delayed response. Common causes are page builders, tag managers, chat widgets and ad scripts. Record an interaction in the Chrome DevTools Performance panel and look for long tasks, then remove, defer or replace the offending script.
Should I lazy-load every image?
No. Lazy load images below the fold, but never the main image visible when the page first loads. Lazy-loading the LCP image delays it and hurts your score. WordPress core tries to avoid lazy-loading the first content image, but themes and plugins can override that, so inspect the HTML of your LCP element.
Do Core Web Vitals affect WooCommerce stores differently?
Stores have more uncached, dynamic pages and more JavaScript, so INP and TTFB problems are common on cart, checkout and filtered product pages. You also lose some benefit from full-page caching on those URLs. An object cache, fewer plugins and lighter product galleries matter more for stores than for blogs.
Can I pass Core Web Vitals on cheap shared hosting?
Often yes for simple, cached sites, but not reliably. If the server is overloaded, even cached pages can respond slowly at peak times, and uncached pages will suffer. If your diagnosis shows high TTFB despite caching, upgrading hosting is a legitimate fix.
Why does Search Console say there is not enough data?
Google’s documentation says a URL group needs a minimum amount of LCP and CLS data to appear, and that groups below the threshold are omitted. New properties can take a few days for existing data to show. For low-traffic pages, use lab tools for diagnosis.
What is the difference between Total Blocking Time and INP?
web.dev explains that INP cannot be measured in the lab because Lighthouse loads pages without a user, so Total Blocking Time is used as a lab proxy. TBT reflects main thread blocking during load. INP reflects how real interactions responded for real visitors. They often move together, but they are not the same number.
Do I need a real user monitoring tool?
Not at first. Search Console and PageSpeed Insights show whether a problem exists. A RUM tool becomes useful when you need to know which interaction or element causes a poor INP, because web.dev notes CrUX often lacks that context. Weigh the cost of its own script.
Can speculative loading help my vitals?
It is designed to speed up navigation to a likely next page by prefetching it, and WordPress 6.8 enables a conservative prefetch mode by default. It does not change how fast the first page loads for a new visitor, so it is not a fix for a failing LCP on landing pages.
What is the back/forward cache?
web.dev describes it as a browser feature that restores a page instantly with its previous layout when a user navigates back or forward. Pages must be eligible, and headers such as Cache-Control: no-store can prevent it. It helps perceived speed on return navigation, not the first load.
Should I fix mobile or desktop first?
Fix whichever report fails, and start with mobile, since mobile hardware and networks make most thresholds harder to meet. Google reports the two separately, so a fix for one may not change the other.
Conclusion and next steps
Fixing core web vitals wordpress sites need is less about installing more plugins and more about diagnosis. Start with real-user data to learn which metric fails, find the specific element or script behind it, and fix that one thing. For LCP, that means fast HTML, a lean hero image and correct priority. For INP, it means removing and delaying JavaScript. For CLS, it means reserving space for everything that loads late.
Your next steps: open Search Console, find the failing URL group, and run PageSpeed Insights on one page from it. Then choose a caching foundation using our caching plugin comparison, deal with your images using the image optimization guide, and return to the full speed optimization guide for the wider picture. Change one thing at a time, measure it, and keep a log. That discipline beats any one-click fix.
Keep reading
WordPress Speed Optimization: The Complete Guide
WordPress speed optimization step by step: measure first, fix hosting, caching, images, scripts, database and plugins, and avoid the mistakes that cost you speed.
Best WordPress Caching Plugins Compared
Compare the best WordPress caching plugins by hosting, budget and workflow: WP Rocket, FlyingPress, LiteSpeed Cache, W3TC, free options and how to test them.
WP Rocket Alternatives: Free and Paid Options
Compare the best wp rocket alternatives, free and paid, by what each one replaces, where it falls short, and how to switch without breaking your site.
Optimize Images in WordPress: WebP, AVIF and Lazy Loading
Learn how to optimize images wordpress sites rely on: resize, compress, convert to WebP or AVIF, and lazy load correctly without hurting your LCP.
WordPress Security: The Complete Guide for Site Owners
WordPress security explained for site owners: how sites get hacked, the layers that stop it, a hardening checklist and what to do if you are attacked.
Let your AI assistant do this for you
Open the ready prompt with step‑by‑step instructions for running it through NibWP.